Description
Target Audience
- Business Analysts
- Data Scientists
- Marketing Professionals
- Project Managers
- Decision-makers and Executives
- Communication Specialists
- Researchers
Course Objectives
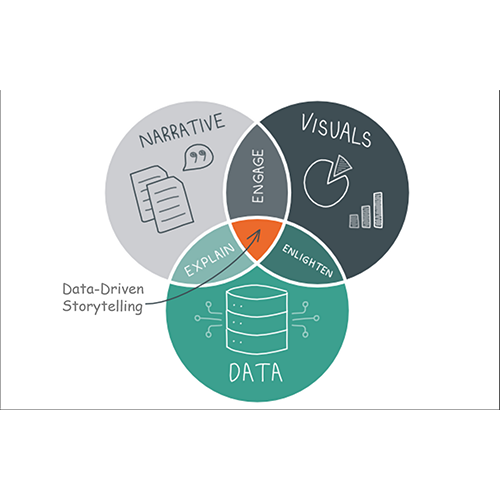
- Understand the principles of Data-Driven Storytelling & Presentations.
- Analyze and interpret data to uncover compelling narratives.
- Create impactful visualizations that enhance storytelling.
- Develop and deliver engaging, data-driven presentations.
- Utilize advanced tools like Tableau and Power BI for storytelling.
- Avoid common pitfalls in data interpretation and visualization. All these in Data-Driven Storytelling & Presentations
Module 1: Introduction to Data Storytelling
- Understanding the importance and elements of data storytelling
- Differences between reporting and storytelling
- Identifying your audience and tailoring your narrative
- Case Study: Examining successful corporate data stories
Module 2: Data Analysis for Storytelling
- Techniques to interpret data and uncover narratives
- Using statistical tools to support stories
- Avoiding data interpretation pitfalls
- Case Study: Lessons from real-world data misinterpretation
Module 3: Creating Impactful Visuals
- Principles of effective data visualization
- Selecting appropriate charts and graphs
- Enhancing visuals with color and layout
- Avoiding misleading visuals
- Case Study: Comparing effective vs. ineffective visualizations
Module 4: Delivering Data-Driven Presentations
- Structuring presentations for maximum impact
- Incorporating storytelling into delivery
- Techniques to engage diverse audiences
- Case Study: Breakdown of a successful global presentation
Module 5: Tools for Data Storytelling
- Overview of tools like Tableau, Power BI, and presentation software
- Hands-on practice creating visuals and presentations
- Integrating data with storytelling techniques
- Case Study: Building a complete data-driven story using provided tools.